
Sign in

Annual Report 2024-25 – Financial Performance

We recently published our Annual Report. Please see some further information below on our financial performance for the year.

How each £1 is spent

Repairs and maintenance – 32p

New homes – 26p

Business operations – 23p

Customers and communities – 11p

Energy efficiency and sustainability – 8p

Section separator

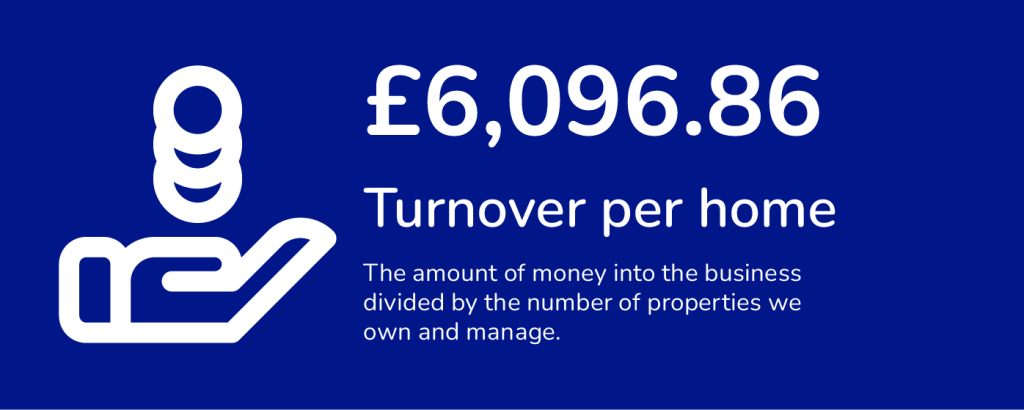
£6,096.86 - Turnover per home - The amount of money into the business divided by the number of properties we own and manage.

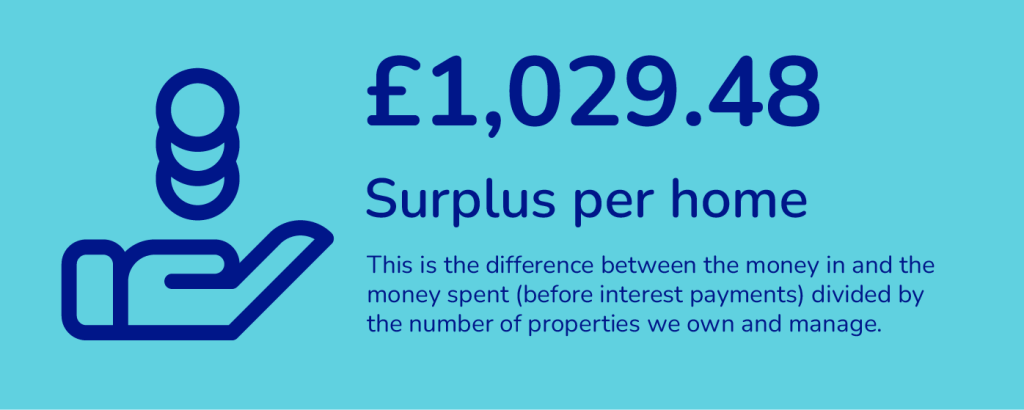
£1,029.48 - Surplus per home - This is the difference between the money in and the money spent (before interest payments) divided by the number of properties we own and manage.

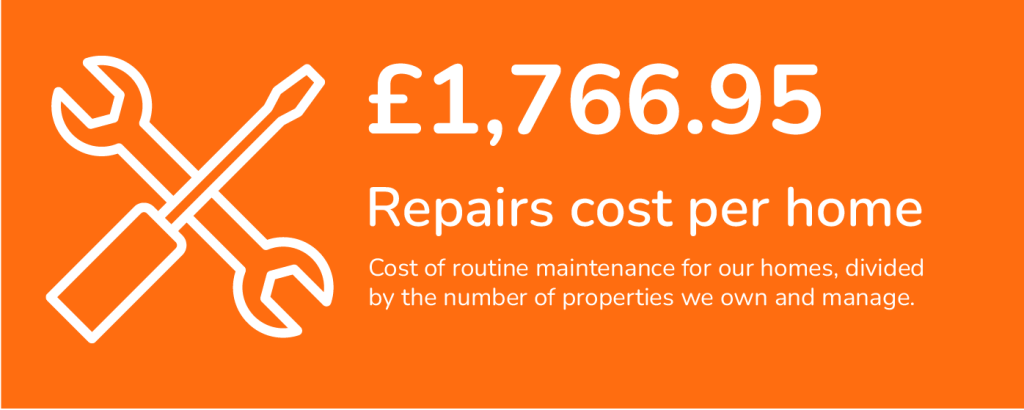
£1,766.95 - Repairs cost per home - Cost of routine maintenance for our homes, divided by the number of properties we own and manage.

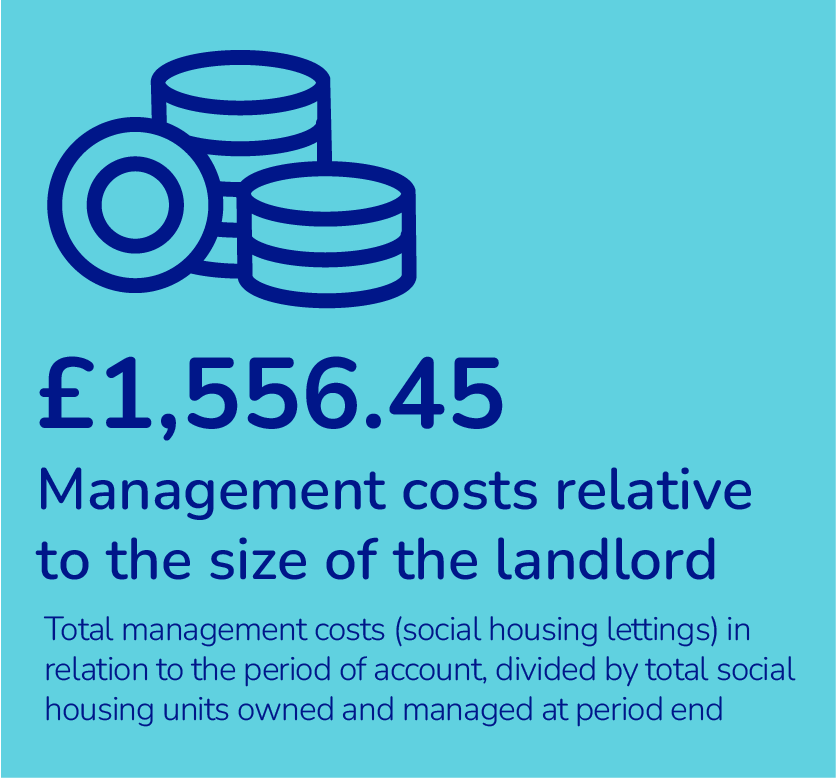
£1,556.45. Management costs relative to the size of the landlord. Total management costs (social housing lettings) in relation to the period of account, divided by total social housing units owned and managed at period end.

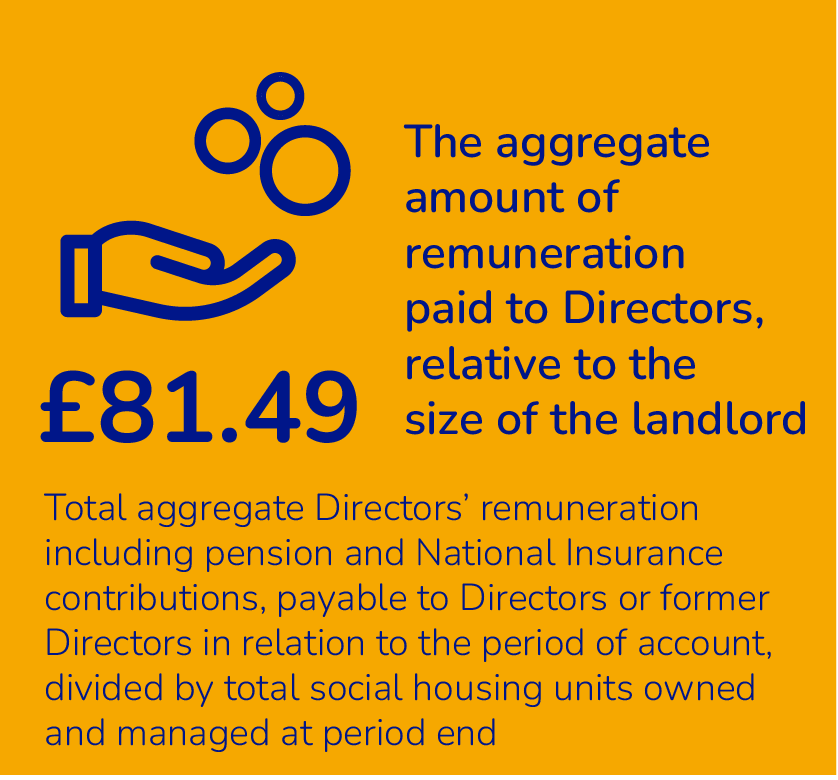
£81.49. The aggregate amount of remuneration paid to Directors, relative to the size of the landlord. Total aggregate Directors’ remuneration including pension and National Insurance contributions, payable to Directors or former Directors in relation to the period of account, divided by total social housing units owned and managed at period end

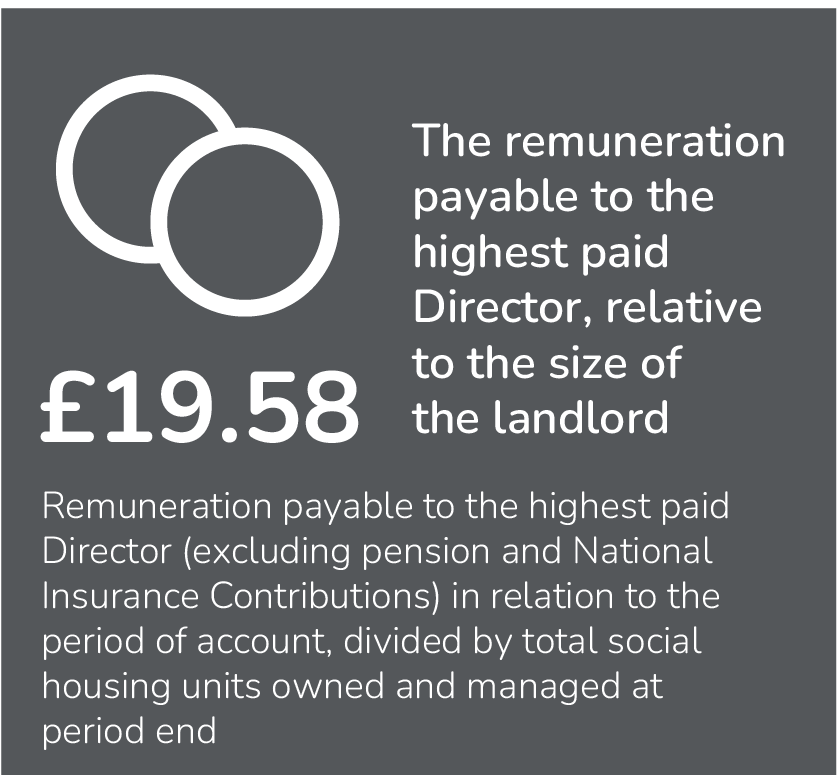
£19.58. The remuneration payable to the highest paid Director, relative to the size of the landlord. Remuneration payable to the highest paid Director (excluding pension and National Insurance Contributions) in relation to the period of account, divided by total social housing units owned and managed at period end.